A candlestick chart is a type of financial chart used to display the price movement of an asset over a specific period. It shows four key data points for each time interval: the opening price, closing price, highest price, and lowest price. This visual format helps traders quickly understand how the market behaved during that timeframe.
In crypto markets, crypto candlestick charts are widely used because they provide a clear and structured way to analyze price movements across different timeframes. By studying these charts, traders can observe patterns, identify potential trends, and make more informed decisions.
For anyone looking to learn to read candlestick charts, understanding how each candle represents market sentiment is an essential first step.
Also Read: What Is Crypto Market Cap and How Does It Matter?
What are Crypto Candlestick Charts?
A crypto candlestick chart is a visual representation of the trading activity of a specific crypto asset. These crypto candlestick charts display detailed market data, including the asset’s opening and closing prices, its highest and lowest levels, and how its price changes over different time intervals. Each candlestick on the chart represents a single period of trading and highlights the asset’s opening price, closing price, highest point, and lowest point during that timeframe.
Unlike traditional stock markets, which operate during fixed trading hours, the crypto market runs 24/7. As a result, the opening and closing prices shown in crypto candlestick charts correspond to the start and end of selected time intervals such as one minute, one hour, or one day, rather than the beginning and end of a trading day.
When placed together sequentially, candlesticks form a historical view of price movements, helping traders identify patterns and trends in the market. Learning how to read candlestick charts in crypto can therefore be an important skill for anyone looking to analyze market behavior and make informed trading decisions.
At first glance, these charts may appear complex because of the large amount of information they present. However, once traders learn to read candlestick charts, they can gain valuable insights into market sentiment, momentum, and potential price movements. In this article, we will explore the fundamentals of crypto candlestick charts, their key components, different candlestick patterns, and practical ways to interpret them effectively as part of a broader crypto trading strategy.
Anatomy of a Candlestick
A candlestick chart comprises two primary components: the body and the wick.
The body, depicted as a thicker bar within the candlestick, represents the opening and closing prices of the asset under observation. Typically, in chart displays, a green body signifies a price rise during the designated time frame, whereas a red body indicates a price decline.
On the other hand, the wick, a slender line extending from the body, denotes the highest and lowest price levels recorded within the given period. In most chart setups, the color of the wick aligns with that of the body.
Also Read: How to Learn Technical Analysis?
Key Components of a Candlestick Explained
Candlesticks are made up of a few important elements that together reveal how prices moved during a specific interval:
The Body of a Candlestick
The body is the thick, central portion of a candlestick. It represents the difference between the opening price and the closing price during a specific timeframe.
If the closing price is higher than the opening price, the candlestick is typically displayed in green or white, indicating bullish momentum. If the closing price is lower than the opening price, the candle is usually shown in red or black, signaling bearish pressure.
Understanding the body is a fundamental part of how to read candlestick charts in crypto, as it helps traders quickly determine whether buyers or sellers dominated the market during that period.
Upper and Lower Wicks (Shadows)
The thin lines extending above and below the body are called wicks or shadows. These lines represent the highest and lowest prices reached during the trading interval.
The upper wick shows how high the price moved before pulling back, while the lower wick shows how low the price dropped before recovering. Long wicks often indicate strong price rejection at those levels.
Open, High, Low, and Close Prices
Each candlestick summarizes four important price points:
- Open: The price at which the asset started trading during the selected timeframe
- High: The highest price reached during that period
- Low: The lowest price reached during the period
- Close: The price at which the asset finished trading for that timeframe
Together, these four values form the foundation of crypto candlestick charts, giving traders a complete picture of price behavior within a specific interval.
Also Read: 10 Best Cryptos to Buy Under $1 in March 2026
Types of Candlestick Patterns Traders Should Know
Bullish Candlestick Patterns
Bullish patterns indicate that buying pressure may be increasing and that prices could move upward. These patterns often appear after a downtrend and may signal a potential reversal or continuation of upward momentum.
Examples include the hammer pattern, bullish engulfing pattern, and morning star pattern.
Bearish Candlestick Patterns
Bearish patterns suggest that selling pressure is strengthening and that prices may decline. These patterns typically appear near the top of an uptrend and may signal a potential reversal to the downside.
Examples include the shooting star, bearish engulfing pattern, and evening star pattern.
Neutral Candlestick Patterns
Neutral patterns reflect market indecision. In these situations, neither buyers nor sellers have clear control over the market. These patterns may appear before a breakout or trend shift.
Doji candles are one of the most common examples of neutral candlestick patterns.
Also Read: What Are Crypto Options? A Complete Guide!
Common Candlestick Patterns Used in Technical Analysis
Various candlestick patterns exist, with some of the key ones outlined below:
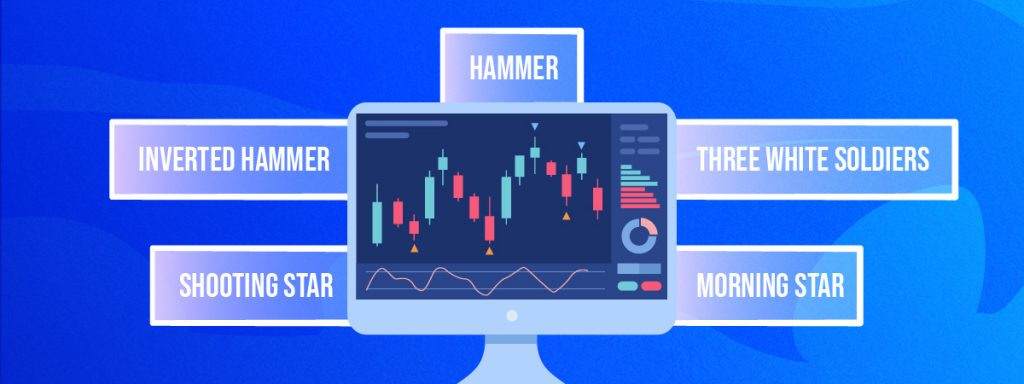
Hammer
The hammer candlestick features a short body accompanied by a notably longer lower shadow, resembling the shape of an upright hammer. Typically found at the bottom of a downtrend, this pattern signifies resistance from bulls against selling pressure, resulting in a price rebound. While both green and red hammers can occur, green ones suggest a stronger uptrend.
Inverted Hammer
Similar to the standard hammer pattern, the inverted hammer exhibits a much longer upper shadow and a short lower wick. This pattern indicates initial buying pressure followed by unsuccessful attempts by bears to lower the price. Consequently, buyers return with increased pressure, propelling prices upward.
Shooting Star
Characterized by a lengthy top wick, minimal or absent bottom wick, and a small body, ideally situated near the bottom, the shooting star resembles an inverted hammer but appears after an uptrend. It suggests a market peak followed by a takeover from sellers, resulting in a price decline. Some traders prefer confirmation from subsequent candlesticks before acting on this pattern.
Morning Star
Comprising three candlesticks—a long red one, followed by a short-bodied candle, and finally a long green candle—the morning star pattern indicates diminishing selling pressure from the initial period and the emergence of a bullish market trend.
Three White Soldiers
Consisting of three consecutive green candlesticks, each opening within the previous candle’s body and closing above its height, the three white soldiers’ pattern reflects sustained buying pressure, propelling prices higher. The absence of long lower wicks is indicative of this continuous upward momentum. The size of the candlesticks and the length of their wicks can provide insights into potential continuation or retracement trends.
Also Read: Crypto Technical Analysis For Beginners
How Candlestick Charts Help Identify Market Trends
Candlestick charts are widely used in technical analysis because they reveal market trends and price momentum. By observing sequences of candles, traders can determine whether an asset is moving in an upward trend, downward trend, or sideways consolidation.
For example, a series of higher highs and higher lows often indicates a bullish trend, while lower highs and lower lows may signal a bearish trend.
Learning how to read candlestick charts in crypto allows traders to recognize these patterns early and adapt their trading strategies accordingly.
How to Combine Candlestick Charts With Other Indicators
While candlestick patterns can provide valuable insights, many traders combine them with additional technical indicators for more reliable analysis.
Indicators such as moving averages, the Relative Strength Index (RSI), and the Moving Average Convergence Divergence (MACD) can help confirm signals observed in candlestick patterns.
For example, a bullish candlestick pattern that appears near a strong support level or alongside an oversold RSI reading may strengthen the probability of a price reversal.
Combining these tools can significantly improve the effectiveness of crypto candlestick charts in trading analysis.
Tips for Beginners Learning to Read Candlestick Charts
For beginners, the best approach to mastering candlestick analysis is gradual learning and consistent practice.
Start by understanding the basic structure of candles and how they represent price movement. Next, focus on identifying common patterns and observing how they appear in real market conditions.
Practicing with historical data and demo trading environments can help traders learn to read candlestick charts without risking real capital.
Over time, as traders become more comfortable with interpreting price action, crypto candlestick charts can become a powerful tool for analyzing markets and developing more confident trading strategies.
Limitations of Candlestick Chart Analysis
Although candlestick charts are powerful analytical tools, they are not perfect predictors of future price movements.
One limitation is that candlestick patterns often rely on interpretation. Different traders may view the same pattern differently depending on their strategy or timeframe.
Additionally, candlestick signals may produce false positives, especially during periods of extreme volatility or low liquidity. This is why many traders use candlestick analysis alongside other indicators and risk management strategies.
Conclusion
Using candlestick charts can serve as a valuable starting point in your crypto trading journey, enabling you to gauge the potential for price fluctuations. Each candlestick pattern offers insights into short-term market sentiment and decision-making processes. As candlesticks are among the simplest indicators to interpret, they can provide deeper insights into price movements, particularly when used alongside other technical analysis tools.
However, it is crucial to remember that candlesticks alone should not dictate your trading decisions, regardless of your level of experience in crypto trading, especially when dealing with larger trading volumes. Candlestick patterns do not guarantee future price movements, and there have been numerous occasions when the market has defied the expected direction indicated by these patterns.
Nevertheless, candlestick patterns should be part of every crypto trader’s toolkit, including those engaged in day trading, as they exhibit similar efficacy to those in stock markets. While they can offer valuable individual trading signals, we recommend combining these patterns with other technical analysis indicators to either confirm or refute their significance.
Also Read: Can Chart Patterns Help with Crypto Trading
In the grand scheme of things, ZebPay blogs are here to provide you with crypto wisdom. Get started today and join 6 million+ registered users to explore endless features on ZebPay!
FAQs on How to Read Candlestick Charts
What is a candlestick chart and how does it work in trading?
A candlestick chart is a visual tool used in trading to display an asset’s price movements over a specific time period. Each candlestick represents four key price points, them being open, high, low, and close, within a selected timeframe. By studying crypto candlestick charts, traders can observe how prices have moved historically and identify patterns that may indicate potential market trends or reversals.
What do the body and wicks of a candlestick represent?
The body of a candlestick shows the difference between the opening and closing prices during a given timeframe. If the closing price is higher than the opening price, the candle typically appears bullish (often green), while a lower closing price indicates a bearish candle (often red).
The wicks, also known as shadows, represent the highest and lowest prices reached during that period. Understanding the relationship between the body and wicks is essential for anyone learning how to read candlestick charts in crypto.
How can traders identify bullish and bearish signals using candlestick charts?
Traders identify bullish and bearish signals by observing the structure and sequence of candlesticks on the chart. For example, patterns such as a hammer or bullish engulfing candle may indicate increasing buying pressure and a possible upward reversal. On the other hand, patterns like the shooting star or bearish engulfing candle may signal growing selling pressure. Learning to recognize these signals is a key step when traders learn to read candlestick charts.
What are the most common candlestick patterns used in technical analysis?
Some of the most widely recognized candlestick patterns include the Doji, Hammer, Engulfing, Morning Star, and Shooting Star. These patterns help traders interpret market sentiment and anticipate potential price movements. When studying crypto candlestick charts, traders often combine these patterns with other technical tools to strengthen their analysis.
How do candlestick charts help traders understand market trends?
Candlestick charts help traders understand trends by visually displaying price momentum and market behavior over time. A series of higher highs and higher lows may indicate a bullish trend, while lower highs and lower lows may signal a bearish trend. By analyzing these movements in crypto candlestick charts, traders can better identify trend directions and potential reversal points.
Can beginners easily learn how to read candlestick charts?
Yes, beginners can gradually learn to read candlestick charts with practice and proper guidance. Starting with the basics such as understanding candle bodies, wicks, and common patterns can make the process easier. Over time, observing real market charts and studying historical patterns helps build confidence in interpreting price movements.
What indicators are commonly used alongside candlestick charts?
Many traders combine candlestick analysis with technical indicators such as Moving Averages, the Relative Strength Index (RSI), and Moving Average Convergence Divergence (MACD). These indicators help confirm signals observed in candlestick patterns and provide additional insights into market momentum, trend strength, and potential entry or exit points.
What are the limitations of relying solely on candlestick chart patterns?
While candlestick patterns can provide useful insights, they do not guarantee future price movements. Market conditions, external events, and sudden volatility can affect price behavior in unpredictable ways. Because of this, relying only on candlestick patterns may lead to inaccurate conclusions. Traders often combine candlestick analysis with other indicators, risk management strategies, and broader market research to make more balanced trading decisions.